Obtain sensitivity alpha-curves associated to MLP function obtained from
the sensitivities returned by SensAnalysisMLP.
Usage
AlphaSensAnalysis(
sens,
tol = NULL,
max_alpha = 15,
curve_equal_origin = FALSE,
inp_var = NULL,
line_width = 1,
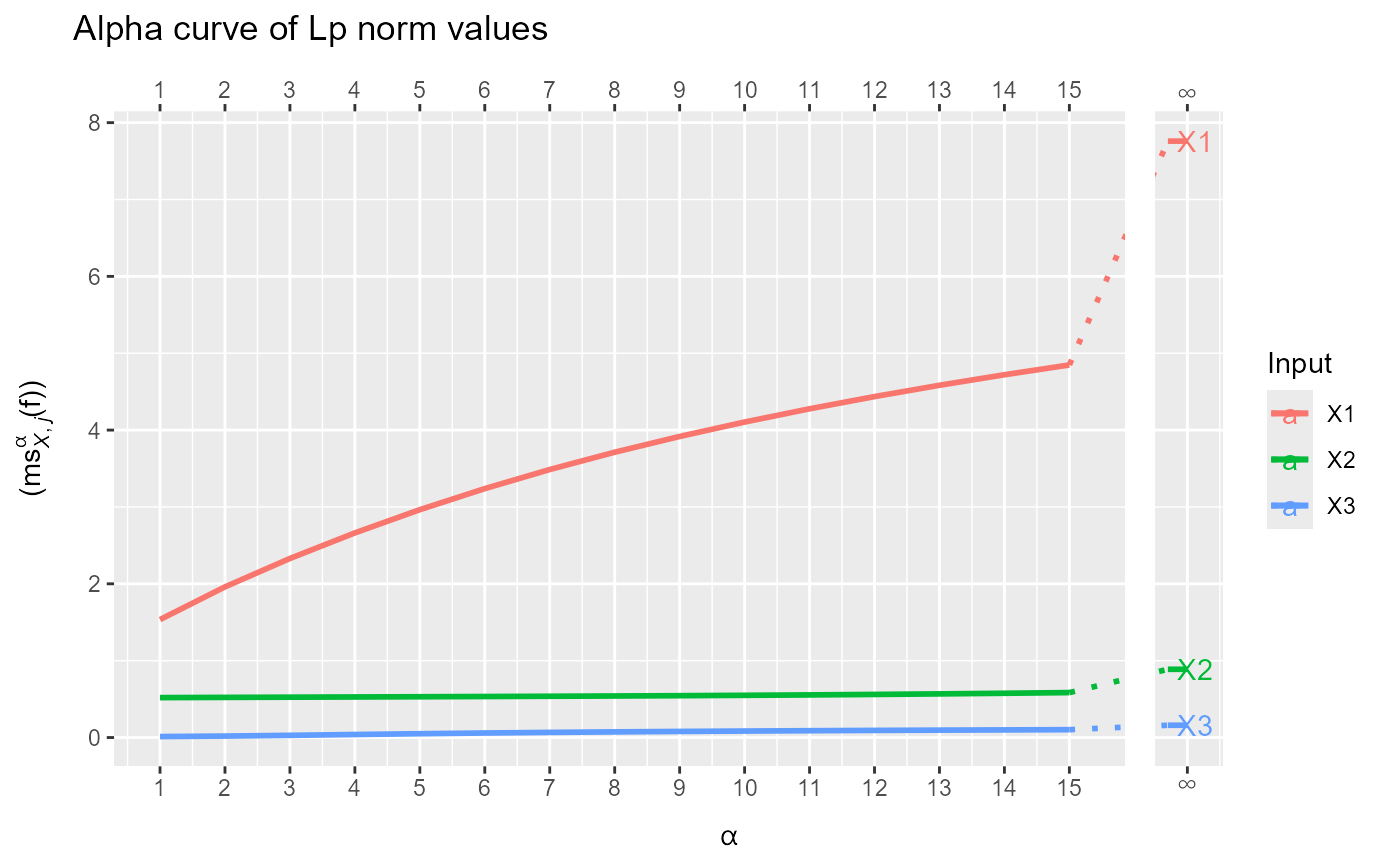
title = "Alpha curve of Lp norm values",
alpha_bar = 1,
kind = "line"
)Arguments
- sens
sensitivity object returned by
SensAnalysisMLP- tol
difference between M_alpha and maximum sensitivity of the sensitivity of each input variable
- max_alpha
maximum alpha value to analyze
- curve_equal_origin
make all the curves begin at (1,0)
- inp_var
characterindicating which input variable to show in density plot. Only useful when choosing plot_type='raw' to show the density plot of one input variable. IfNULL, all variables are plotted in density plot. By default isNULL.- line_width
intwidth of the line in the plot.- title
chartitle of the alpha-curves plot- alpha_bar
intalpha value to show as column plot.- kind
charselect the type of plot: "line" or "bar"
Examples
# \donttest{
mod <- RSNNS::mlp(simdata[, c("X1", "X2", "X3")], simdata[, "Y"],
                 maxit = 1000, size = 15, linOut = TRUE)

sens <- SensAnalysisMLP(mod, trData = simdata,
                        output_name = "Y", plot = FALSE)

AlphaSensAnalysis(sens)

# }
# }