Function to plot the sensitivities created by HessianMLP.
Arguments
- hess
HessMLPobject created byHessianMLP.- sens
SensMLPobject created bySensAnalysisMLP.- output
numericorcharacterspecifying the output neuron or output name to be plotted. By default is the first output (output = 1).- metric
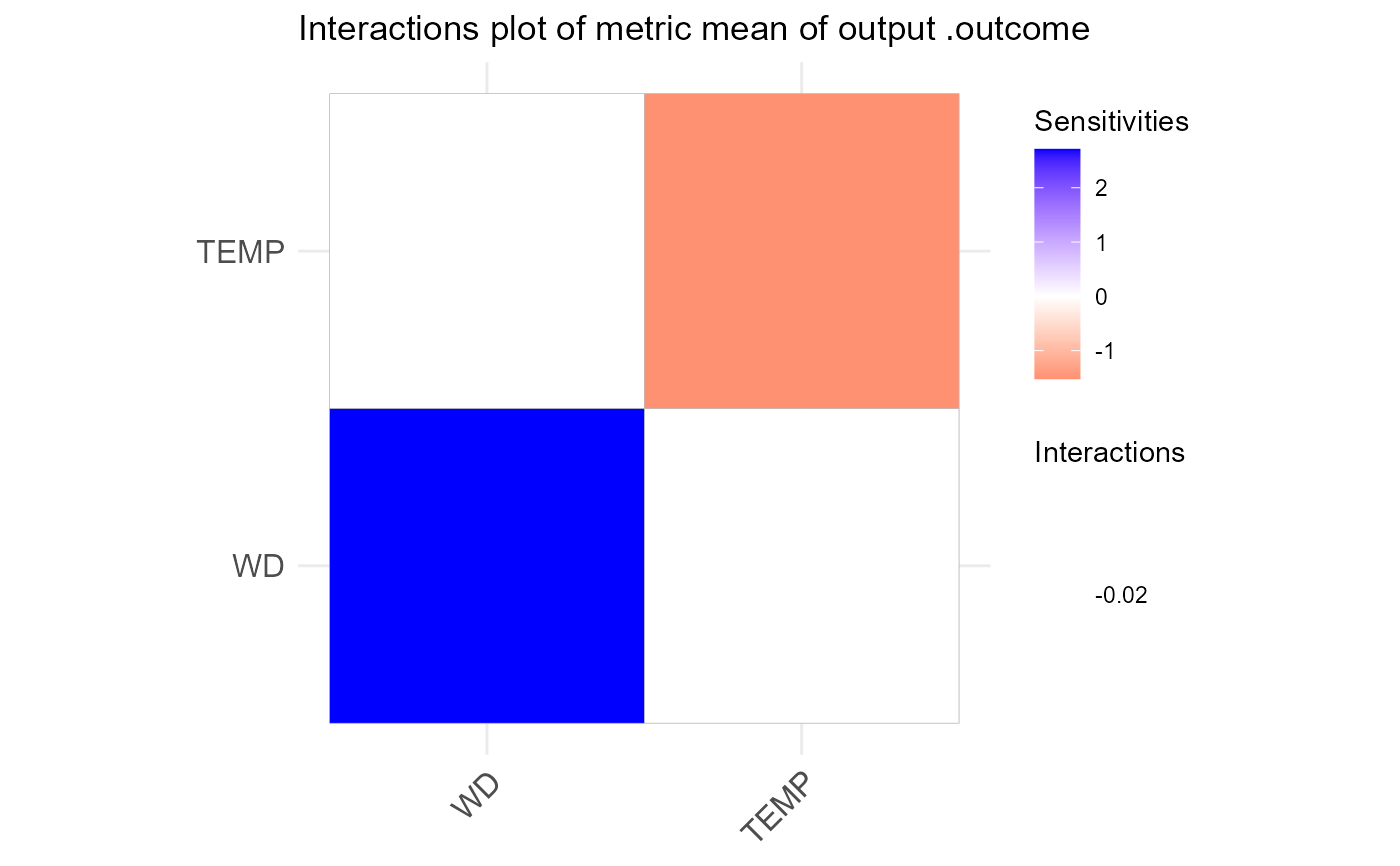
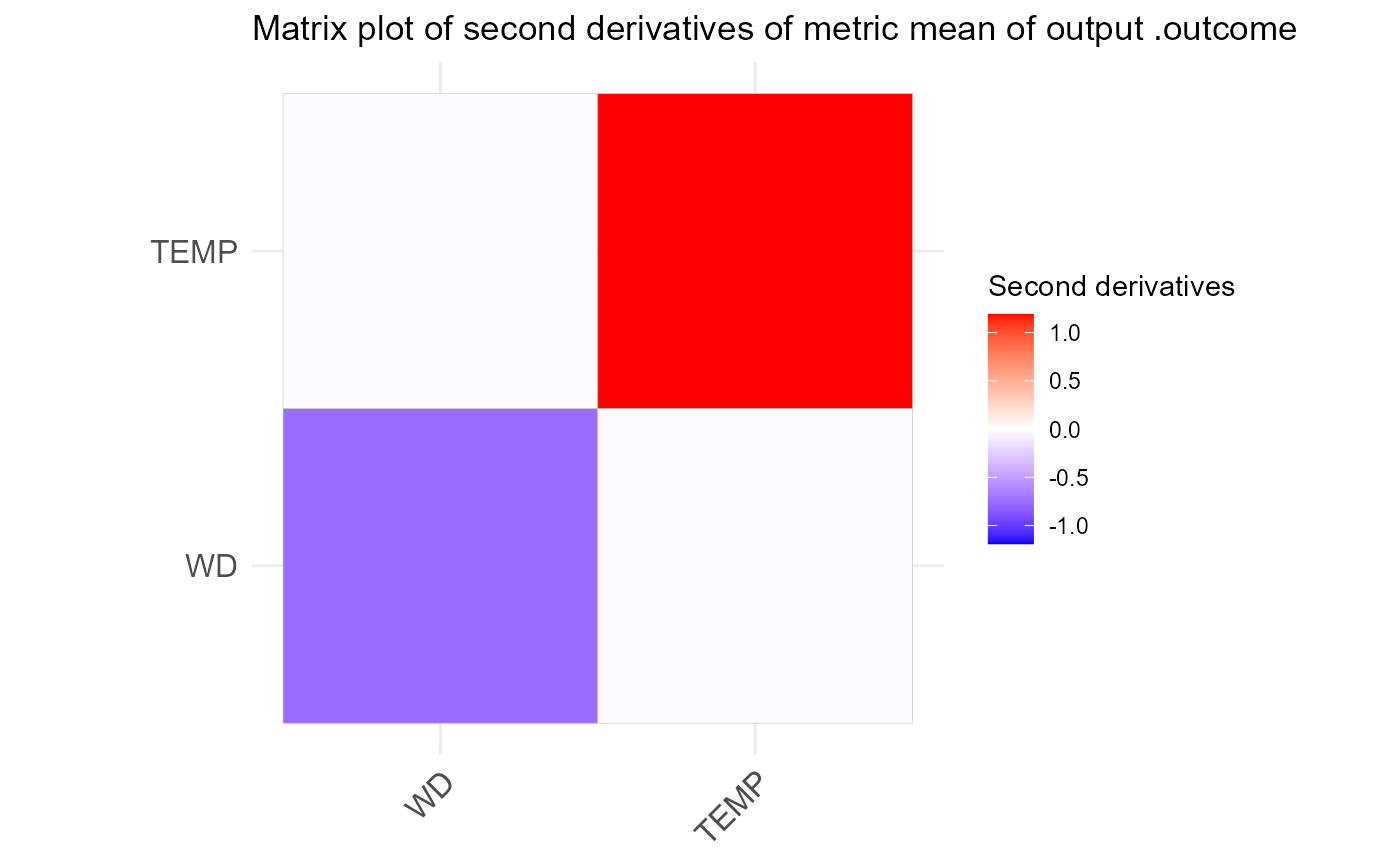
characterspecifying the metric to be plotted. It can be "mean", "std" or "meanSensSQ".- senstype
characterspecifying the type of plot to be plotted. It can be "matrix" or "interactions". If type = "matrix", only the second derivatives are plotted. If type = "interactions" the main diagonal are the first derivatives respect each input variable.- ...
further argument passed similar to
ggcorrplotarguments.
Value
a list of ggplots, one for each output neuron.
Details
Most of the code of this function is based on
ggcorrplot() function from package ggcorrplot. However, due to the
inhability of changing the limits of the color scale, it keeps giving a warning
if that function is used and the color scale overwritten.
Examples
## Load data -------------------------------------------------------------------
data("DAILY_DEMAND_TR")
fdata <- DAILY_DEMAND_TR
## Parameters of the NNET ------------------------------------------------------
hidden_neurons <- 5
iters <- 100
decay <- 0.1

################################################################################
#########################  REGRESSION NNET #####################################
################################################################################
## Regression dataframe --------------------------------------------------------
# Scale the data
fdata.Reg.tr <- fdata[,2:ncol(fdata)]
fdata.Reg.tr[,3] <- fdata.Reg.tr[,3]/10
fdata.Reg.tr[,1] <- fdata.Reg.tr[,1]/1000

# Normalize the data for some models
preProc <- caret::preProcess(fdata.Reg.tr, method = c("center","scale"))
nntrData <- predict(preProc, fdata.Reg.tr)

#' ## TRAIN nnet NNET --------------------------------------------------------
# Create a formula to train NNET
form <- paste(names(fdata.Reg.tr)[2:ncol(fdata.Reg.tr)], collapse = " + ")
form <- formula(paste(names(fdata.Reg.tr)[1], form, sep = " ~ "))

set.seed(150)
nnetmod <- nnet::nnet(form,
                      data = nntrData,
                      linear.output = TRUE,
                      size = hidden_neurons,
                      decay = decay,
                      maxit = iters)
#> # weights:  21
#> initial  value 2487.870002
#> iter  10 value 1587.516208
#> iter  20 value 1349.706741
#> iter  30 value 1333.940734
#> iter  40 value 1329.097060
#> iter  50 value 1326.518168
#> iter  60 value 1323.148574
#> iter  70 value 1322.378769
#> iter  80 value 1322.018091
#> final  value 1321.996301
#> converged
# Try HessianMLP
H <- NeuralSens::HessianMLP(nnetmod, trData = nntrData, plot = FALSE)
NeuralSens::SensMatPlot(H)

S <- NeuralSens::SensAnalysisMLP(nnetmod, trData = nntrData, plot = FALSE)
NeuralSens::SensMatPlot(H, S, senstype = "interactions")
S <- NeuralSens::SensAnalysisMLP(nnetmod, trData = nntrData, plot = FALSE)
NeuralSens::SensMatPlot(H, S, senstype = "interactions")