Plot the sensitivities and sensitivity metrics of a SensMLP object.
Arguments
- x
SensMLPobject created bySensAnalysisMLP- plotType
characterspecifying which type of plot should be created. It can be:"sensitivities" (default): use
SensAnalysisMLPfunction"time": use
SensTimePlotfunction"features": use
SensFeaturePlotfunction
- ...
additional parameters passed to plot function of the
NeuralSenspackage
Value
list of graphic objects created by ggplot
References
Pizarroso J, Portela J, Muñoz A (2022). NeuralSens: Sensitivity Analysis of Neural Networks. Journal of Statistical Software, 102(7), 1-36.
Examples
#' ## Load data -------------------------------------------------------------------
data("DAILY_DEMAND_TR")
fdata <- DAILY_DEMAND_TR
## Parameters of the NNET ------------------------------------------------------
hidden_neurons <- 5
iters <- 250
decay <- 0.1
################################################################################
######################### REGRESSION NNET #####################################
################################################################################
## Regression dataframe --------------------------------------------------------
# Scale the data
fdata.Reg.tr <- fdata[,2:ncol(fdata)]
fdata.Reg.tr[,3] <- fdata.Reg.tr[,3]/10
fdata.Reg.tr[,1] <- fdata.Reg.tr[,1]/1000
# Normalize the data for some models
preProc <- caret::preProcess(fdata.Reg.tr, method = c("center","scale"))
nntrData <- predict(preProc, fdata.Reg.tr)
#' ## TRAIN nnet NNET --------------------------------------------------------
# Create a formula to train NNET
form <- paste(names(fdata.Reg.tr)[2:ncol(fdata.Reg.tr)], collapse = " + ")
form <- formula(paste(names(fdata.Reg.tr)[1], form, sep = " ~ "))
set.seed(150)
nnetmod <- nnet::nnet(form,
data = nntrData,
linear.output = TRUE,
size = hidden_neurons,
decay = decay,
maxit = iters)
#> # weights: 21
#> initial value 2487.870002
#> iter 10 value 1587.516208
#> iter 20 value 1349.706741
#> iter 30 value 1333.940734
#> iter 40 value 1329.097060
#> iter 50 value 1326.518168
#> iter 60 value 1323.148574
#> iter 70 value 1322.378769
#> iter 80 value 1322.018091
#> final value 1321.996301
#> converged
# Try SensAnalysisMLP
sens <- NeuralSens::SensAnalysisMLP(nnetmod, trData = nntrData, plot = FALSE)
# \donttest{
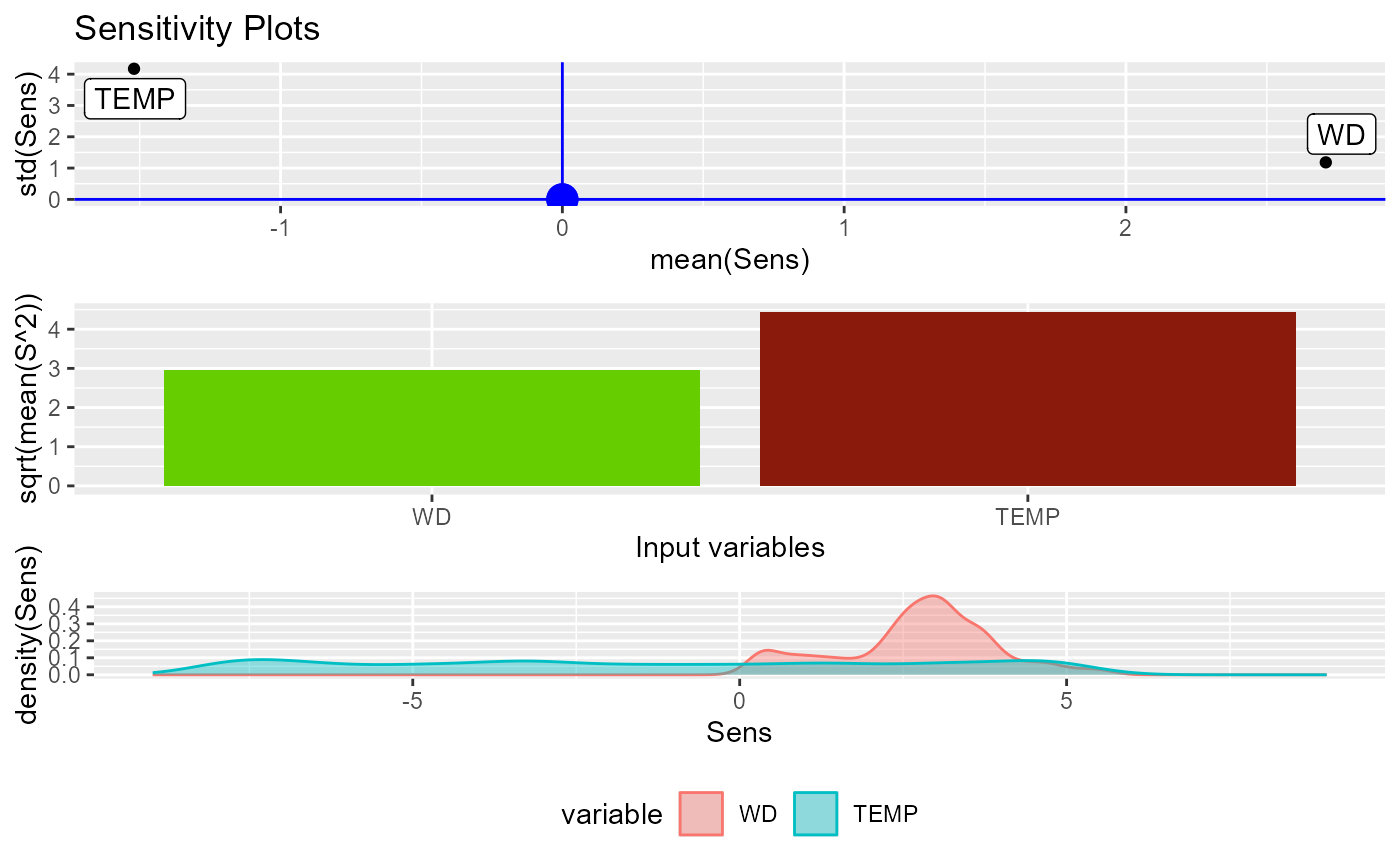
plot(sens)
#> Warning: All aesthetics have length 1, but the data has 2 rows.
#> ℹ Did you mean to use `annotate()`?
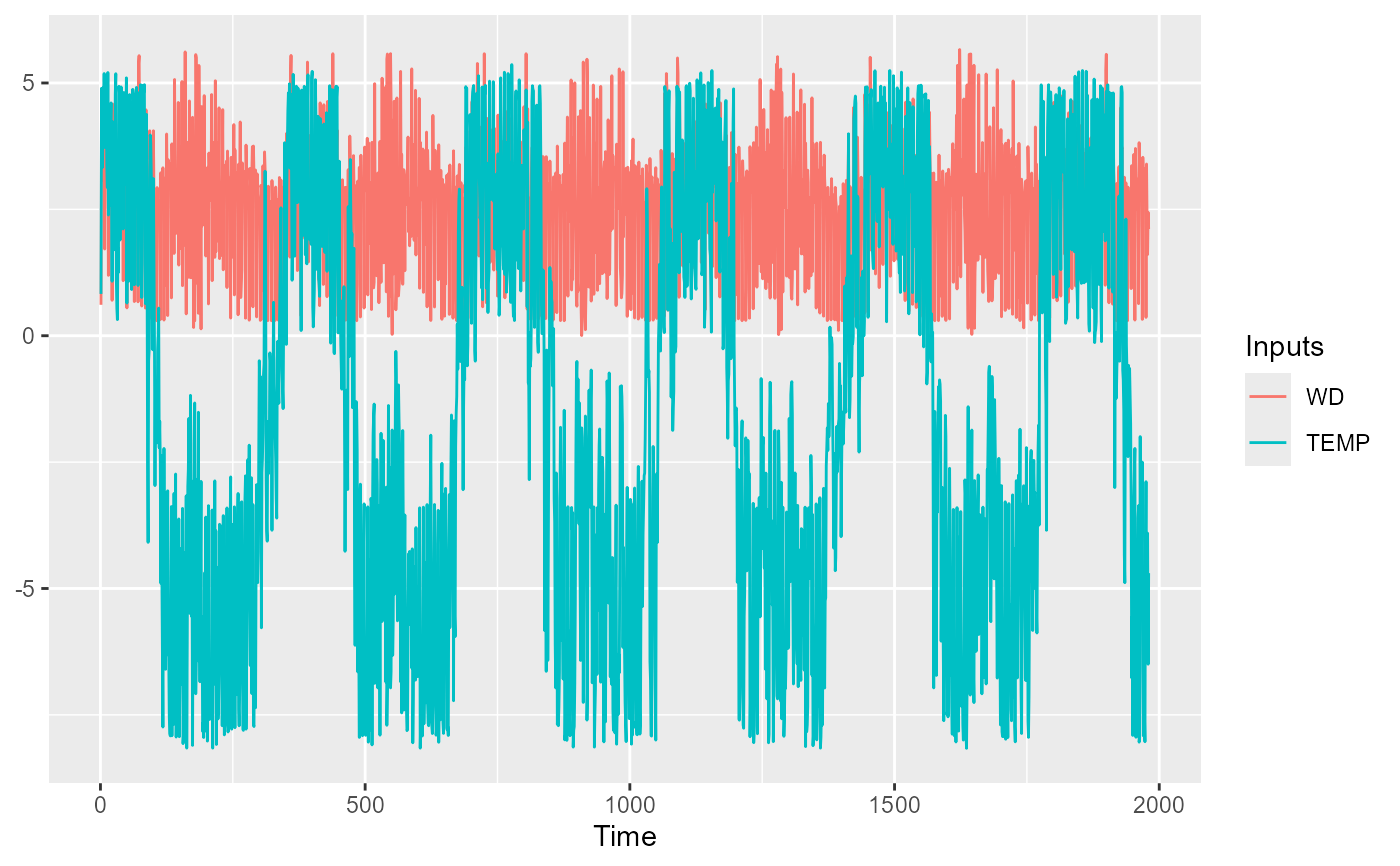
 plot(sens,"time")
#> Warning: Use of `plotdata$value` is discouraged.
#> ℹ Use `value` instead.
#> Warning: Use of `plotdata$variable` is discouraged.
#> ℹ Use `variable` instead.
#> Warning: Use of `plotdata$variable` is discouraged.
#> ℹ Use `variable` instead.
plot(sens,"time")
#> Warning: Use of `plotdata$value` is discouraged.
#> ℹ Use `value` instead.
#> Warning: Use of `plotdata$variable` is discouraged.
#> ℹ Use `variable` instead.
#> Warning: Use of `plotdata$variable` is discouraged.
#> ℹ Use `variable` instead.
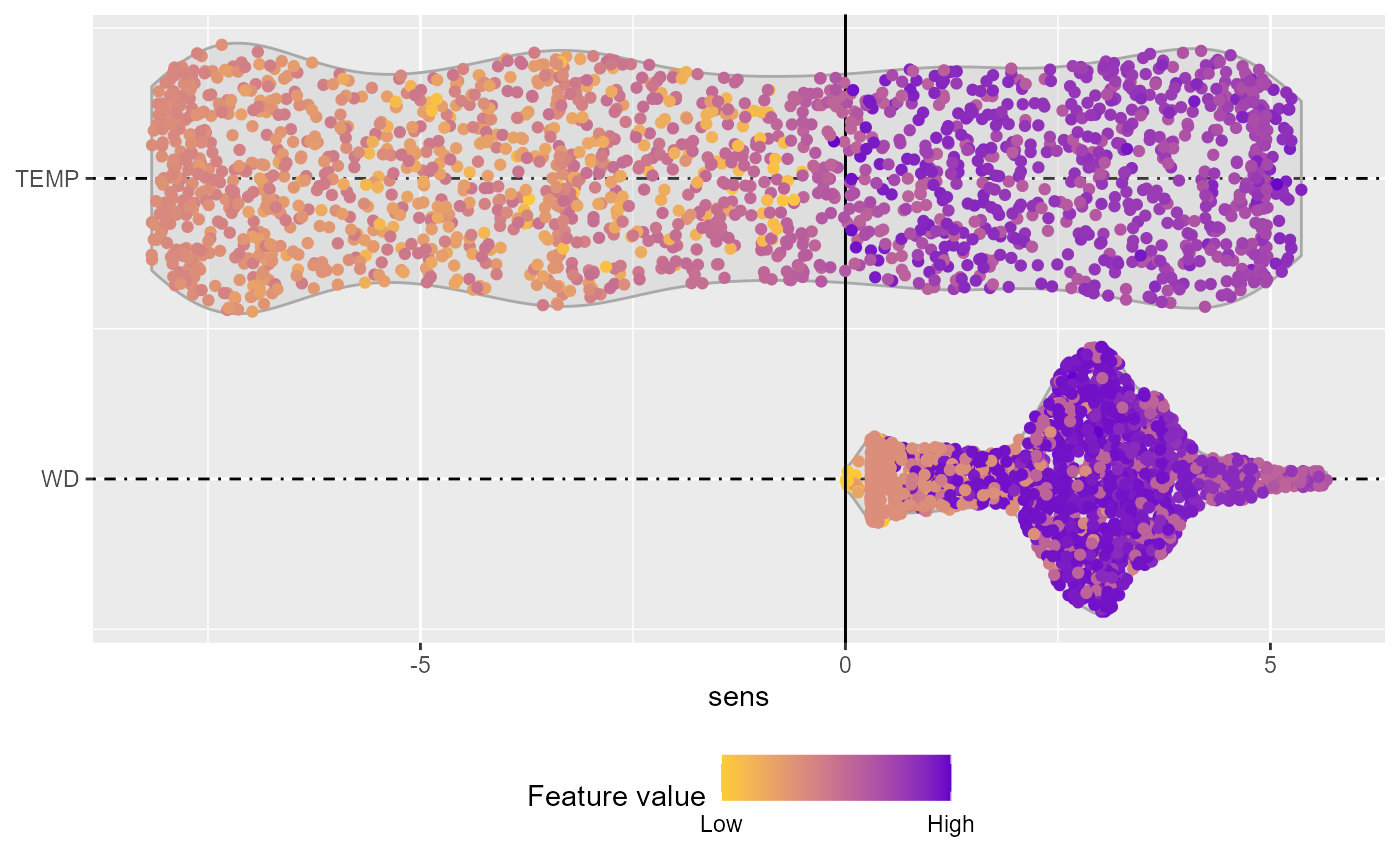
 plot(sens,"features")
 # }
# }